SCOMNET - Support Holding?
 |
| SCOMNET Weekly Chart |
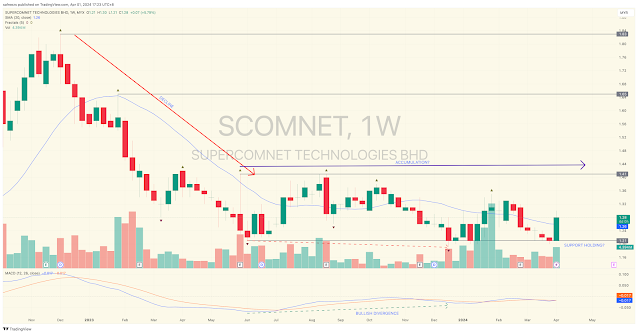
SCOMNET has been moving sideways between 1.21 and 1.41 since early Jun 2023. It has tested its support at 1.21 twice in Dec 23-Jan 24 period and now, and, both times showing demand by bouncing off it with above average volume. A move higher looks likely with the next resistance at 1.41 as a potential target.
Disclaimer:
Trading and investment involves risk, including possible loss of principal and other losses. I shall not be responsible for any losses or loss profit resulting from trading or investment decision based on my posting and any information presented in this blog.


Comments
Post a Comment