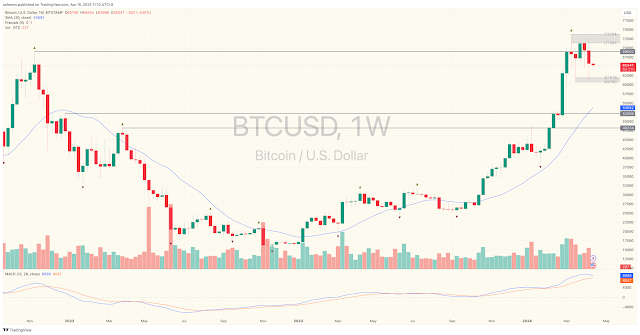
Bitcoin - Consolidating Sideways?
 |
| BTCUSD Weekly Chart |
 |
| BTCUSD Daily Chart |
On Apr 03, 2023, I wrote BTCUSD correction could be longer and deeper with the next supports at 60,760 and 52,099. See link below.
Weekly chart shows BTCUSD is still in an uptrend although it is currently undergoing correction. The correction is likely to be longer still and it appears that BTCUSD is consolidating sideways between 60,760 and 73,794.
Disclaimer:
Trading and investment involves risk, including possible loss of principal and other losses. I shall not be responsible for any losses or loss profit resulting from trading or investment decision based on my posting and any information presented in this blog.


Comments
Post a Comment