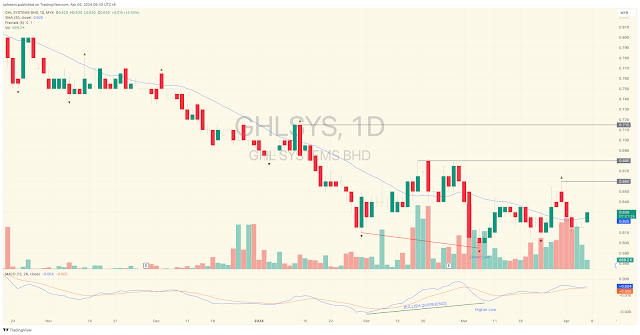
GHLSYS - Potential Bottom?
 |
| GHLSYS Daily Chart |
Daily chart shows GHLSYS has been in a decline phase but may have bottomed out? On Mar 06, 2024 GHLSYS made a lower low but its MACD traced a higher low indicating the bearish momentum may have weakened. In addition, trading volume have increased significantly showing interest.
Disclaimer:
Trading and investment involves risk, including possible loss of principal and other losses. I shall not be responsible for any losses or loss profit resulting from trading or investment decision based on my posting and any information presented in this blog.


Comments
Post a Comment