GHLSYS - Breakout!
 |
| GHLSYS Weekly Chart |
 |
| GHLSYS Daily Chart |
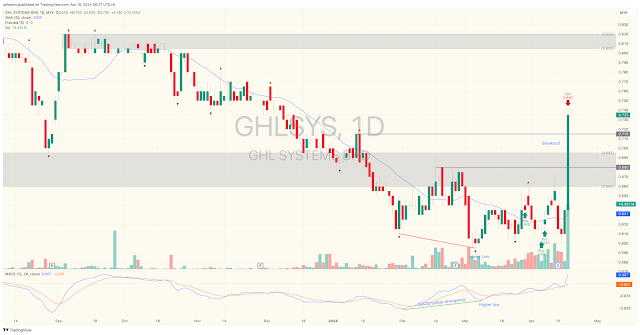
On Apr 05, 2024, I wrote that GHLSYS may have bottomed out after tracing a MACD bullish divergence, where price made a lower low but MACD made a higher low. See blog below.
https://swingtrader188.blogspot.com/2024/04/ghlsys-potential-bottom.html
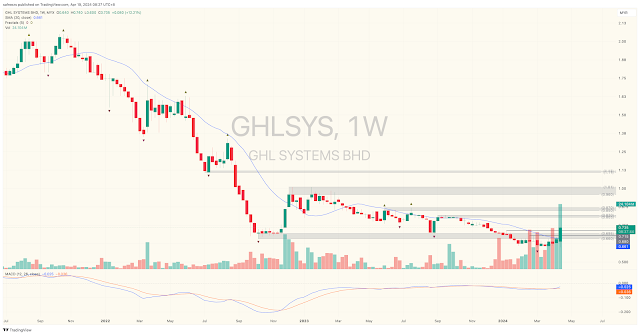
Yesterday (Apr 19, 2024) GHLSYS staged a breakout with a long bullish green candle on heavy volume showing strong demand. Further upside is now likely with the next resistance at 0.805-0.820 although there could be profit taking along the way.Disclaimer:
Trading and investment involves risk, including possible loss of principal and other losses. I shall not be responsible for any losses or loss profit resulting from trading or investment decision based on my posting and any information presented in this blog.


Comments
Post a Comment