DNEX - Potential Bottom?
 |
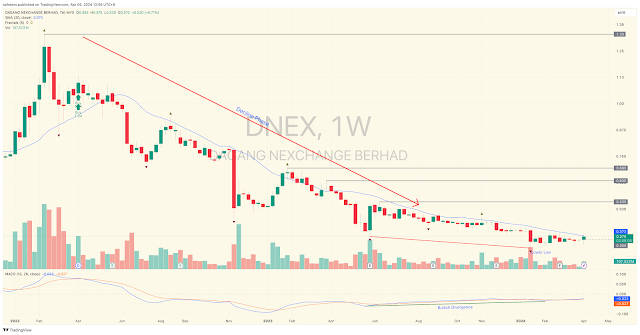
| DNEX Weekly Chart |
Weekly chart shows DNEX has been in a decline phase after reaching a peak at 1.33 in Feb 2022. Recent price action, however, is indicating the decline phase could be over when its price made lower low in Jan 2024 whilst its MACD traced a higher low to form a MACD bullish divergence.
Disclaimer:
Trading and investment involves risk, including possible loss of principal and other losses. I shall not be responsible for any losses or loss profit resulting from trading or investment decision based on my posting and any information presented in this blog.


Comments
Post a Comment