Forex Weekly Watchlists: 04 to 08 May 2020
 |
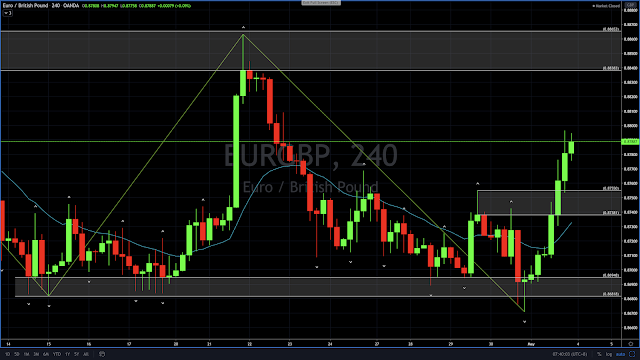
| EURGBP 4-Hour Chart |
EURGBP short-term trend has turned bullish after taking out its SR zone at 0.8738-0.8755. I will look for a buy setup if EURGBP retraces back to that SR zone.
 |
| GBPCHF 4-Hour Chart |
GBPCHF short-term trend has turned bearish after breaking below the neckline of a double top reversal pattern. I will look for a sell setup if GBPCHF retraces up to the neckline SR zone at 1.2070-1.2093.
 |
| USDCAD 4-Hour Chart |
USDCAD rallied strongly after bouncing off its major SR zone at 1.3850-1.3882 to trade above its 20ema line. I will look for buy setup if USDCAD retraces down to its SR zone at 1.3998-1.4005.
 |
| AUDJPY 4-Hour Chart |
AUDJPY declined sharply from a bearish shooting star candle with 4 consecutive long bearish candles to close well below its 20ema. I will look for sell setup if AUDJPY retraces up to its SR zone at 69.24-69.51.
 |
| NZDJPY 4-Hour Chart |
NZDJPY declined sharply from a bearish shooting star candle with 4 consecutive long bearish candles to close below its 20ema. I will look for sell setup if NZDJPY retraces up to its SR zone at 65.15-65.28.
Disclaimer:
Trading and investment involves risk, including possible loss of principal and other losses. I shall not be responsible for any losses or loss profit resulting from trading or investment decision based on my posting and any information presented in this blog.


Comments
Post a Comment