Dow Jones Rally Over?
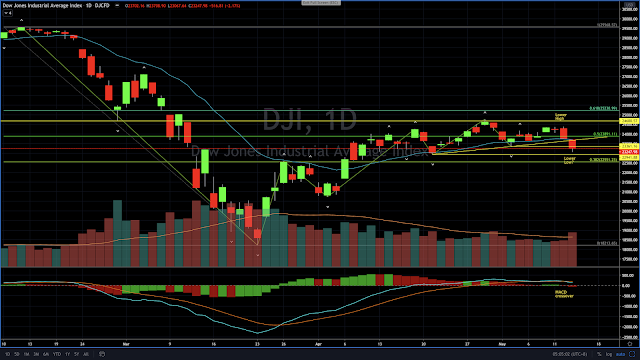
DJI technical picture on the daily chart looks worrying. It shows DJI is starting to make lower high and potentially a lower low after testing support become resistance level at 24680 and the Fibonacci 50% retrace level of the sharp decline from mid Feb 2020. This suggests the recent rally is starting to weaken. In addition the MACD line has crossed below its signal line adding further evidence to a bearish outlook moving forward.
 |
| DJI Daily Chart |
 |
| DJI Daily Chart Closeup View |
 |
| DJI Weekly Chart |
Disclaimer:
Trading and investment involves risk, including possible loss of principal and other losses. I shall not be responsible for any losses or loss profit resulting from trading or investment decision based on my posting and any information presented in this blog.


Comments
Post a Comment