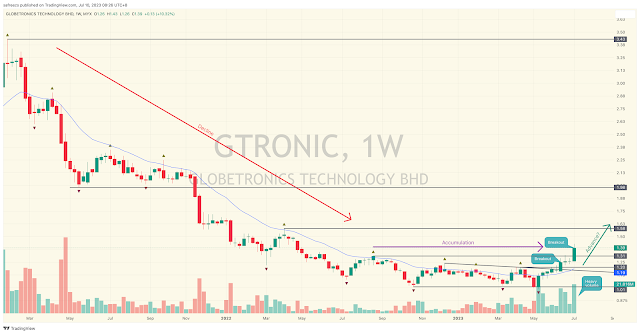
GTRONIC broke resistance!
 |
| GTRONIC Weekly Chart |
 |
| GTRONIC Daily Chart |
This is a follow-up to my posting on 21 Jun 2023.
https://swingtrader188.blogspot.com/2023/06/gtronic-transitioning-to-advance-phase.htmlLast week GTRONIC broke out above its resistance at 1.31 on heavy volume. It has transitioned to advance phase. For potential entry, I will go down to the daily chart to look for a pullback to the 20-day moving average(MA) line. The potential upside targets are its next resistance at 1.58 and 1.98 with a stop loss below the 20-day MA.
Disclaimer:
Trading and investment involves risk, including possible loss of principal and other losses. I shall not be responsible for any losses or loss profit resulting from trading or investment decision based on my posting and any information presented in this blog.


Comments
Post a Comment