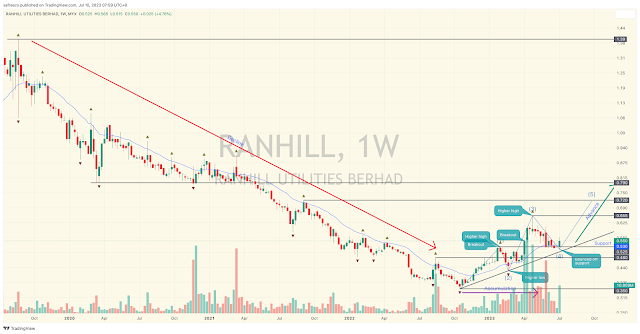
RANHILL - Pullback Buy Setup?
 |
| RANHILL Weekly Chart |
Last week it bounced off its support at 0.525 with a bullish candle on heavy volume after a retrace from its high at 0.655 creating a potential pullback buy setup. Potential targets are at its resistance at 0.655 and 0.72 with a stop loss below its uptrend line.
Disclaimer:
Trading and investment involves risk, including possible loss of principal and other losses. I shall not be responsible for any losses or loss profit resulting from trading or investment decision based on my posting and any information presented in this blog.


Comments
Post a Comment