WTI Long Trade 07 May 2021 Breakeven
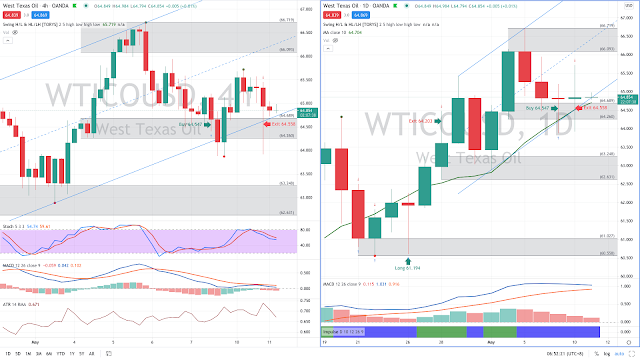
These were the chart observation at the time when the trade was considered on 07 May 2021.
See WTI Daily and 4hr charts below.
 |
| WTI Daily and 4hr charts |
ENTRY:
Entered long on 07 May 2021 16.04hr at 64.547 when WTI tested its support zone. The initial stop loss order was placed at 63.85 based on ATR reading of 70 pips. Take profit order was placed at the opposing resistance zone at 66.20.
EXIT:
Moved stop to breakeven after WTI moved up 1R. The move up however did not continue. Instead it declined to hit my breakeven stop at 64.558 on 10 May 2021 22.01hr.
Disclaimer:
Trading and investment involves risk, including possible loss of principal and other losses. I shall not be responsible for any losses or loss profit resulting from trading or investment decision based on my posting and any information presented in this blog.


Comments
Post a Comment