MALTON
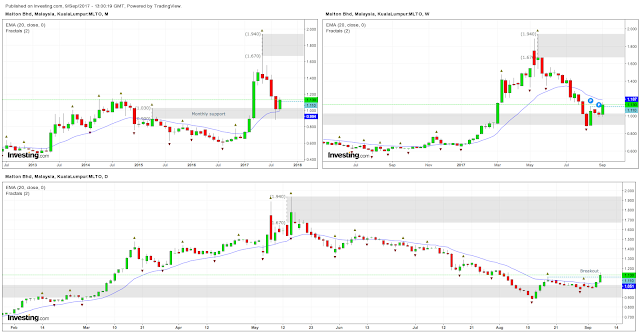
MALTON monthly chart shows that it has pulled back to its monthly support at 0.90-1.03 area. A bullish engulfing candle was formed on the weekly chart the first time that the monthly support area was tested showing demand in this area. It was followed by two red small body candles and a bullish candle that took out the high of the bullish engulfing candle. This appears as a breakout of the previous swing high when we zoomed down to the daily chart. MALTON corrective decline seems to have ended. I expect MALTON to move up over the next few weeks to test it weekly resistance at 1.67-1.94 area.
Disclaimer:
Trading and investment involves risk, including possible loss of principal and other losses. I shall not be responsible for any losses or loss profit resulting from trading or investment decision based on my posting and any information presented in this blog.
 |
| MALTON Multiple TF Charts |
Disclaimer:
Trading and investment involves risk, including possible loss of principal and other losses. I shall not be responsible for any losses or loss profit resulting from trading or investment decision based on my posting and any information presented in this blog.


This market strategy is requirement in the swing trading to set the values at better quantity.
ReplyDeleteStock Cash Tips
MCX Market Tips