Forex Trades Week 15-19 May 2017
Here were my trades:
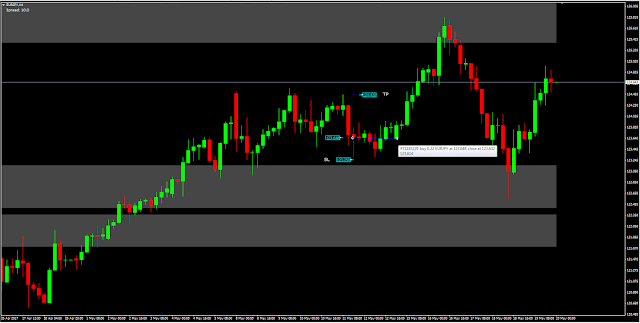
EURJPY (-0.04%)
I entered the trade on 11 May the previous week but carried it over to this week. EURJPY was forming a horizontal corrective structure in a bull trend when I entered the long trade at 123.648. My initial SL was at 123.25 and TP at 124.42.
I was ahead by about 20 pips before the end of the previous week and lowered my SL to breakeven going into the weekend. That was a mistake! I was stopped at the open and EURJPY rallied to my TP and beyond but I was already stopped out. I made a small loss of -0.04%.
 |
| EURJPY H4 Chart |
GBPCHF was retracing after breaking out above a swing high. The price action context was bullish. I entered long on 15 May at 1.2875 expecting that the level would hold and the bull trend would continue. It was not to be. I was stopped out at 1.2830 for a -0.96% loss.
 |
| GBPCHF H4 Chart |
GBPCAD was retracing to a support level in a bull trend. I entered the long trade on 16 May at 1.7560 with an initial SL at 1.7520 and TP at 1.7765.
I took partial profit on 17 May at 1.76651 when it was testing the prior swing high. I made a +1.35% gain. My TP was reached on 18 May and my remaining position was closed at 1.77651 for a +2.44% gain. Overall I made +3.79% on this trade.
 |
| GBPCAD H4 Chart - Trade #1 |
 |
| GBPCAD H4 Chart - Trade #2 |
USDJPY (-0.98%)
USDJPY was retracing after an upside breakout above its downtrend line. See daily chart. I entered the trade on 17 May at 112.25 with a SL at 111.85 and TP at 113.45 expecting that the broken downtrend line to hold. It was not to be. I was stopped out within a few hours at 111.85 for a -0.98% loss.
 |
| USDJPY Daily Chart |
 |
| USDJPY H4 Chart |
This was a silly trade. I entered the trade on 17 May at 2374.8. Fortunately I came back to my sense that I had made an impulse trade. I should have been punished but the market was forgiving that it came back to my entry price to allow me to close the trade at 2374.9 for a breakeven trade at +0.01%.
 |
| SPX500USD H4 Chart |
AUDUSD was retracing to its previous broken support level within a bear trend when I made the trade. I was expecting the level to hold in the classic support become resistance role reversal. I entered short on 15 May at 0.7440 with an initial SL at 0.7470 and TP at 0.7350. It was declining nicely until a better than expected economic news on AUD employment change and unemployment rate on 18 May caused AUDUSD to rally. I chose to manually close the trade at 0.7462 for a -0.82% loss.
 |
| AUDUSD H4 Chart |
GBPAUD (+1.19%)
GBPAUD was retracing to a support level within a bull trend. I entered a bit too early at 1.73997. I should have waited for price to enter the support area. My initial SL was placed at 1.7330 and TP at 1.7610. I took partial profit on 18 May at 1.75587 for a 1.18% gain when it was testing its prior swing high. I then moved my SL to breakeven. GBPAUD declined after that and hit my SL at 1.74908 on 19 May for a breakeven trade of +0.01% on the remaining units. Overall I made 1.19%.
 |
| GBPAUD H4 Chart - Trade #1 |
 |
| GBPAUD H4 Chart - Trade#2 |
Disclaimer:
Trading and investment involves risk, including possible loss of principal and other losses. I shall not be responsible for any losses or loss profit resulting from trading or investment decision based on my posting and any information presented in this blog.


Comments
Post a Comment