MACD - How I use it to support chart analysis
Moving Average Convergence Divergence (MACD) is a technical indicator invented by Gerald Appel. It consist of two lines - the MACD line and the signal line. The MACD line is the difference between a fast Exponential Moving Average (EMA) and a slow EMA, and, the signal line is the EMA of the MACD line. The standard EMA settings for the MACD line are 12-period for the fast EMA and 26-period for the slow EMA, and, for the signal line is 9-period EMA of the MACD line.
I use the standard settings. Here I would like to share with you how I use MACD to support my chart analysis.
The classical way to use MACD is to buy when the MACD line cross from below to above its signal line and to sell when the MACD line cross from above to below its signal line. I use MACD in a slightly different way, where I look at the MACD patterns to provide clues on the likely outcome of a developing chart pattern on the price chart.
Let's look at some recent examples to illustrate how I use MACD.
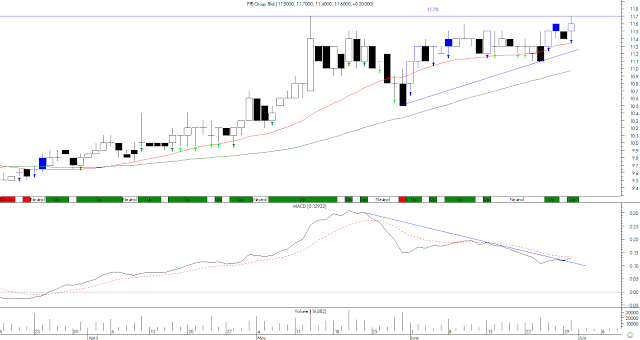 PPB Daily Chart on 30 Jun 09
Daily chart on 30 Jun 09 showed a potential ascending triangle pattern developing for PPB. The overhead resistance was RM11.70. Was it likely to break above its overhead resistance line? MACD line did provide clues - MACD line was turning up and the MACD trendline was broken - suggesting the overhead price resistance was likely to be broken.
 PPB Daily Chart on 15 Jul 09
PPB did breakout above its resistance line at RM11.70 on 1 Jul 09 and since then has been consolidating between RM11.70 and its next overhead resistance, which was the all-time high, at RM12.20. Was it likely to break above it? Again MACD line did provide clues - MACD line was turning up and making higher lows - suggesting the overhead is likely to be broken and PPB could be heading higher.
 PPB Daily Chart on 31 Jul 09
PPB did break above its resistance at RM12.20 on 16 Jul 09. Last Friday on 31 Jul 09 PPB closed at a new all-time high at RM14.70. PPB is now well above its 20-day MA line. We should now think about taking profit.
 GAMUDA Daily Chart on 31 Jul 09
You could have catched GAMUDA upside breakout of its triangle pattern on 14 Jul 09 with similar MACD pattern analysis. Notice that MACD line turned up, making higher lows and MACD trendline was broken on 10 Jul 09, which would have given you advanced clues to get on board before the breakout.
You may also notice that MACD line was also making higher lows on 23 Jul 09 after the recent pullback, which could have provided us advanced clues to get on board before GAMUDA made another upmove.
Disclaimer:
Trading and investment involves risk, including possible loss of principal and other losses. I shall not be responsible for any losses or loss profit resulting from trading or investment decision based on my posting and information presented in this blog.


Comments
Post a Comment