CPO 3rd Month Contract - What is the likely movement for next week?
The 3rd month contract is the most actively traded CPO contract. It serves as the benchmark and now it is the Oct 09 contract.
What is the likely movement of CPO Oct 09 contract for next week? We will look at the weekly and daily price charts for clues.
 CPO 3rd month contract weekly chart on 31 Jul 09
Weekly chart shows that the 20-period MA is rising suggesting the long term trend is up although it is noted that the price is still below the 20-period MA. A bullish engulfing candlestick pattern suggests that short-term decline on CPO price could be ending. The MACD line is however below its signal line and still declining - providing no indication of a rebound.
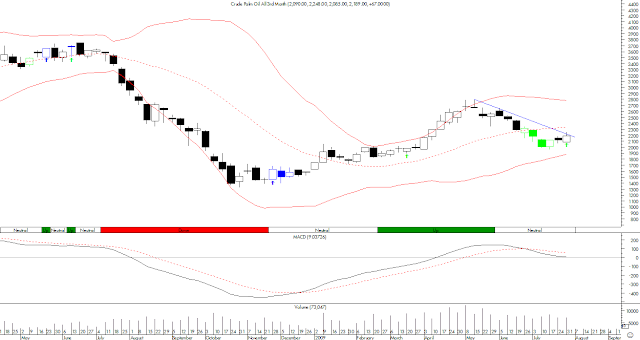
 CPO 3rd month contract daily chart on 31 Jul 09
Daily chart shows a price pattern of higher highs and lows indicating an uptrend. This is supported by the fact that MACD line is rising and above its signal line. Price gapped up last Friday but it failed to close above the downtrend line and ended up forming a Doji candle with long upper tail on relatively high volume near the downtrend line and Bollinger upper band suggesting uncertainty.
What is likely to happen? I do not know but I would be looking for an opportunity to go long. The weekly trend is up but the daily chart suggests uncertainty. The price may go up but I would favour a pullback to the 20-period MA on the daily chart, look for a bullish reversal candle and go long on the rebound.
Disclaimer:
Trading and investment involves risk, including possible loss of principal and other losses. I shall not be responsible for any losses or loss profit resulting from trading or investment decision based on my posting and information presented in this blog.
What is the likely movement of CPO Oct 09 contract for next week? We will look at the weekly and daily price charts for clues.
 CPO 3rd month contract weekly chart on 31 Jul 09
Weekly chart shows that the 20-period MA is rising suggesting the long term trend is up although it is noted that the price is still below the 20-period MA. A bullish engulfing candlestick pattern suggests that short-term decline on CPO price could be ending. The MACD line is however below its signal line and still declining - providing no indication of a rebound.
 CPO 3rd month contract daily chart on 31 Jul 09
Daily chart shows a price pattern of higher highs and lows indicating an uptrend. This is supported by the fact that MACD line is rising and above its signal line. Price gapped up last Friday but it failed to close above the downtrend line and ended up forming a Doji candle with long upper tail on relatively high volume near the downtrend line and Bollinger upper band suggesting uncertainty.
What is likely to happen? I do not know but I would be looking for an opportunity to go long. The weekly trend is up but the daily chart suggests uncertainty. The price may go up but I would favour a pullback to the 20-period MA on the daily chart, look for a bullish reversal candle and go long on the rebound.
Disclaimer:
Trading and investment involves risk, including possible loss of principal and other losses. I shall not be responsible for any losses or loss profit resulting from trading or investment decision based on my posting and information presented in this blog.


Wow great information......... I like your blog... keep going ahead..........
ReplyDelete___________________
Smarry
Email Marketing Solutions