HARTA - Pullback Buy Setup?
 |
| HARTA Weekly Chart |
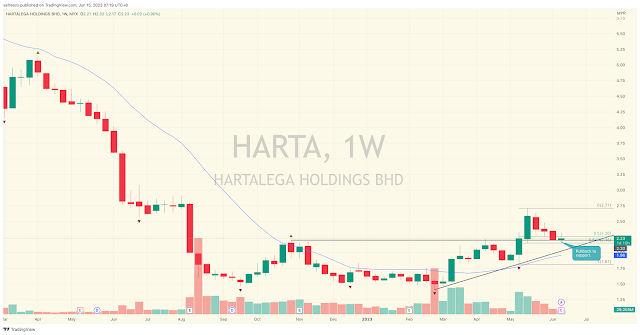
A pullback buy setup appears to be developing on HARTA weekly chart. HARTA appears to have transition to an advance phase after breaking above a sideways consolidation pattern. HARTA is currently testing its support at 2.20 after making a high at 2.71. Should the 2.20 support hold another run up to the 2.71 high is likely.
Disclaimer:
Trading and investment involves risk, including possible loss of principal and other losses. I shall not be responsible for any losses or loss profit resulting from trading or investment decision based on my posting and any information presented in this blog.


Comments
Post a Comment