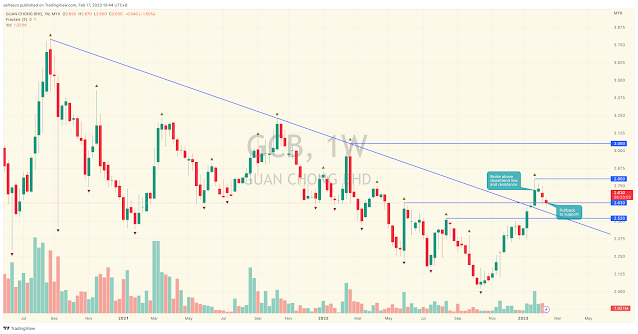
GCB Pullback to Support?
 |
| GCB Weekly Chart |
 |
| GCB Daily Chart |
GCB downtrend appeared to be over when it broke above its downtrend line late Jan 2023 on relatively high volume. It is now testing its support at 2.63 after two weeks of correction on low volume. Will its support hold?
On the fundamental side, GCB pays regular dividend and have been doing so 3x per year for the last 3 years. Top shareholders include EPF and Tabung Haji.
Disclaimer:
Trading and investment involves risk, including possible loss of principal and other losses. I shall not be responsible for any losses or loss profit resulting from trading or investment decision based on my posting and any information presented in this blog.


Comments
Post a Comment