SHELL Potential Peak?
 |
| SHELL Weekly Chart |
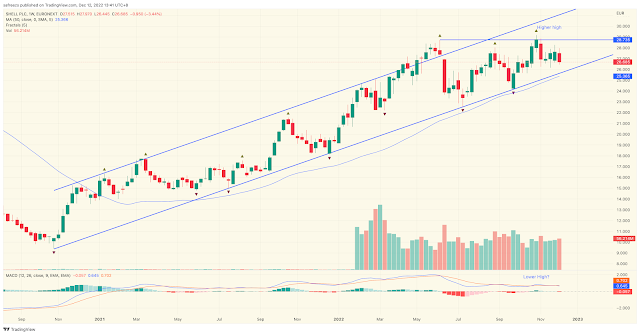
SHELL weekly chart shows a potential bearish divergence between price and MACD indicator where price made a higher high but MACD traced a lower high. This is a negative signal! SHELL has been in a nice uptrend for quite a while. Has SHELL reached its peak?
Disclaimer:
Trading and investment involves risk, including possible loss of principal and other losses. I shall not be responsible for any losses or loss profit resulting from trading or investment decision based on my posting and any information presented in this blog.


Comments
Post a Comment