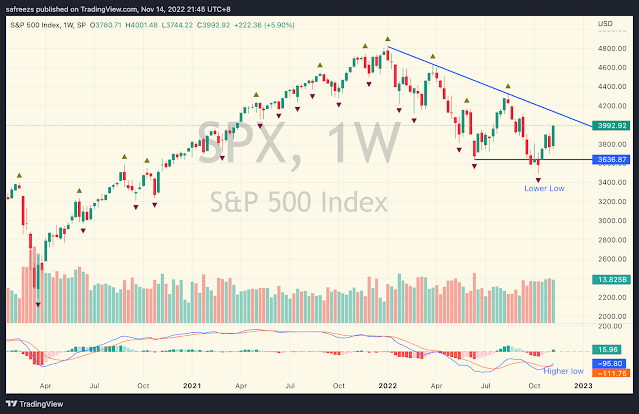
S&P 500 Potential bottom?
 |
| S&P 500 Weekly Chart |
S&P 500 weekly chart shows a bullish divergence between price and MACD, where price made a new low whereas MACD traced a higher low. This suggests a potential bottom may have been made. Breakout of the downtrend line would suggest trend change from down to up is likely. However, breakdown of the support line would suggest further lower low is likely.
Disclaimer:
Trading and investment involves risk, including possible loss of principal and other losses. I shall not be responsible for any losses or loss profit resulting from trading or investment decision based on my posting and any information presented in this blog.


Comments
Post a Comment