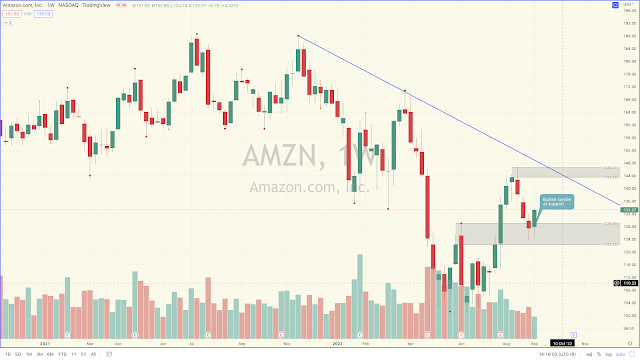
AMAZON Rebounding off support?
 |
| AMZN Weekly Chart |
Disclaimer:
Trading and investment involves risk, including possible loss of principal and other losses. I shall not be responsible for any losses or loss profit resulting from trading or investment decision based on my posting and any information presented in this blog


Comments
Post a Comment