Forex Weekly Outlook: 27 Apr to 01 May 2020
Let me start this week by sharing my view of next week outlook for the major pairs in the Forex market. I will show my analysis on the 4-hour chart since I trade Forex mostly off that chart. I do look at the daily and 1-hour charts but that will a topic for another posting.
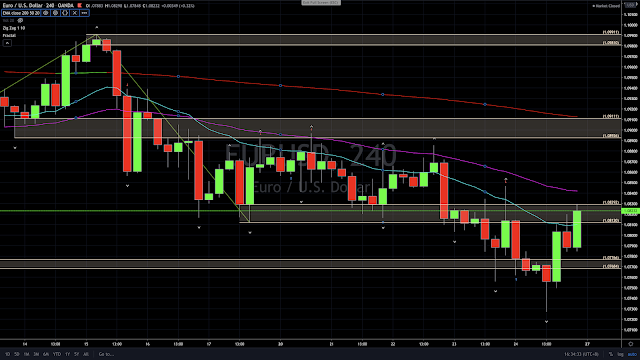
EURUSD has been moving lower since 15 Apr 2020 making lower highs and lower lows. It is currently testing its SR zone at 1.0812-1.0829, which was support but now resistance. It can either break above this zone to test the next higher SR zone or reverse from this zone to move lower. I will wait for next week price action to decide on my course of action.
USDJPY has been moving sideways since 15 Apr 2020 after a trend move down. I will look for a sell setup when USDJPY test its SR zone at 107.92-108.08.
 |
| GBPUSD 4-Hour Chart |
GBPUSD has been moving lower in staircase descending manner since 15 Apr 2020. I will look for a sell set-up when GBPUSD test its SR zone at 1.2408-1.2448.
AUDUSD has been moving sideways after failing to break above its SR zone at 0.6433-0.6462. Recent price action from 21 Apr 2020 has been bullish with AUDUSD making higher highs and higher lows. I expect it to test again its SR zone at 0.6433-0,6462. Just a note, I have an opened long position at 0.63549 with SL at 0.6330 and TP at 0.6440.
 |
| USDCAD 4-Hour Chart |
USDCAD has been moving higher since 14 Apr 2020. It seems to be supported at its SR zone at 1.3999-1.4023. I will wait for another test of the SR zone and then drill down to the 1-hour chart to look for an entry trigger.
 |
| USDCHF 4-Hour Chart |
USDCHF has retraced down after failing to break above its SR zone at 0.9788-0.9797. It is currently testing its SR zone at 0.9714-0.9727, which was resistance but now support. It can either breakdown below this zone to test the next lower SR zone or reverse from this zone to move higher. I will wait for next week price action to decide on my course of action.
 |
| NZDUSD 4-Hour Chart |
NZDUSD has been consolidating in a descending triangle pattern after reaching a high at 0.6130 on 14 Apr 2020. I will be looking for a sell setup at either SR zones at 0.6021-0.6041 or 0.6065-0.6092 or upper line of the triangle pattern.
 |
| XAUUSD 4-Hour Chart |
XAUUSD(Gold) broke above its SR zone at 1696-1702 on 22 Apr 2020 and is currently testing its SR zone at 1734-1747. I will be looking for a buy set-up when XAUUSD retrace down to the broken SR zone, which was resistance but now support.
Disclaimer:
Trading and investment involves risk, including possible loss of principal and other losses. I shall not be responsible for any losses or loss profit resulting from trading or investment decision based on my posting and any information presented in this blog.


Comments
Post a Comment