I completed 8 trades this week with 2 winning trades, 1 breakeven and 5 losing trades. This week I had decided to reduce my risk to 0.5% of my account balance after last week losing week. It was the correct decision to made. Although my hit rate was only 25% but because my losers were small, I still ended up with a gain of
+1.26% of my account size for the week.
GBPUSD (+2.127%)
GBPUSD was in a bear trend on the H4 chart until it formed a potential triple bottom reversal pattern. It broke above the neckline of the bottom reversal pattern and I entered the trade long on pullback at 1.2845 on 01 Jun 2017. I placed my SL at 1.2805 and TP at 1.2930. The trade moved up to my TP target and was closed at 1.29301 on 05 Jun 2017 to net me a
+2.127% gain.
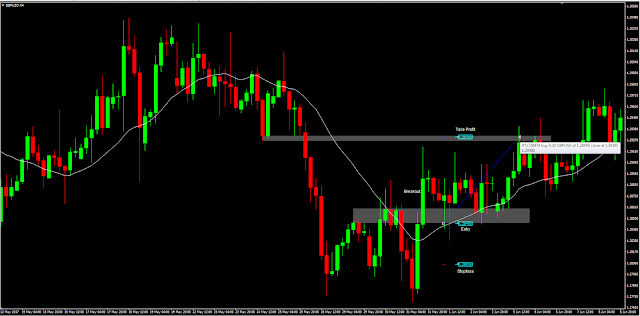 |
| GBPUSD H4 Chart |
EURCAD (-0.467%)
EURCAD was in an uptrend on the H4 chart when I made the trade. It formed a bullish hammer candle at the 20 bar MA line and I entered long on 05 Jun 2017 at 1.51802 with my SL at 1.5130 and TP at 1.5240. I was expecting the uptrend to continue but it did not. It went down instead and I was stopped out at 1.51299 for
-0.467% loss.
 |
| EURCAD H4 chart |
AUDCAD (+1.185%)
AUDCAD was in a bear trend until it took out its last lower swing high. I entered the trade long on pullback on 06 Jun 2017 at 1.0050 with an initial SL at 1.0015 and TP at 1.0150. The trade moved up and when it was near my TP level I raised my SL to 1.0035. AUDCAD did reach my TP but it wriggled down first to hit my revised SL at 1.0035 on 07 Jun 2017. I netted
+1.185% on this trade.
 |
| AUDCAD H4 Chart |
EURCAD (-0.486%)
I was expecting a breakdown of the EURCAD support level when I made this trade. I entered short on 07 Jun 2017 at 1.5135 with a SL at 1.5175 and TP at 1.5030. EURCAD did go down initially but later reversed to take out my SL. I lost
-0.486%.
EURCAD did breakdown eventually but only after the false upside breakout.
 |
| EURCAD H4 Chart |
WTICOUSD (-0.293%)
This was a bad trade. I was anticipating WTICOUSD to reverse up but I did not wait for the potential triple bottom reversal pattern to complete. I entered long on 07 Jun 2017 at 47.15 with a SL at 46.80 and TP at 48.60. I was out very quickly at 46.788 for a
-0.293% loss.
 |
| WTICOUSD H4 Chart |
XAUUSD (-0.546%)
XAUUSD was in an uptrend when I made this trade. I entered the trade after it pulled back to its prior congestion area expecting it to rebound. I entered on 08 Jun 2017 at 1281.941 with a SL at 1276 and TP at 1303. The prior congestion area did not hold and I was stopped out at 1274.659 for
-0.546% loss.
 |
| XAUUSD H4 Chart |
EURJPY (+0.119%)
EURJPY was in a trading range after a bull trend on the H4 chart when I made this trade. I entered long on 07 Jun 2017 at 123.20 when EURJPY was testing its prior swing low. I was apprehensive to hold the trade ahead of the UK election that I manually closed it at 123.35 on 08 Jun 2017. It was more or less a breakeven trade at
+0.119%.
 |
| EURJPY H4 Chart |
USDJPY (-0.379%)
USDJPY broke down below its support level on the H4 chart. I entered short on 08 Jun 2017 at 110.35 with a SL at 110.85 after USDJPY rallied back to the broken support level. It held and USDJPY initially declined but rebounded off the 20 bar MA. I manually exit the trade on 09 Jun 2017 at 110.77 when it approached my SL and the 20 bar MA was turning up. I lost
-0.379% on the trade.
 |
| USDJPY H4 Chart |
Disclaimer:
Trading and investment involves risk, including possible loss of principal and other losses. I shall not be responsible for any losses or loss profit resulting from trading or investment decision based on my posting and any information presented in this blog.


Comments
Post a Comment