NTPM
Back on 20th Nov 09, I wrote under Penny Stocks - Trading Idea that NTPM was one of the penny stocks in a consolidation phase. I promised to revisit in 2 months time.
Let's see what happened to NTPM by reviewing its latest daily chart.
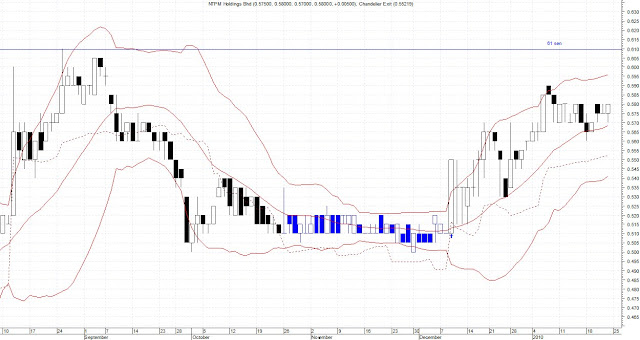
NTPM Daily Chart 22nd Jan 10
NTPM started to consolidate on 26th Oct 09 and was trading between 50 sen to 52.5 sen until it broke out to the upside on 9th Dec 09. The ideal time to buy NTPM was on 30th Nov 09 when it tagged the Bollinger lower band.
After the breakout it went as high as 59 sen and currently is trading at 58 sen. The resistance is 61 sen, which is an all-time high and you know what usually happen when a stock broke its all-time high. But the question is will it reach it? That is a question I cannot answer. However, I do know that the latest swing low is at 56 sen and Chandelier Exit current reading is at 55 sen. Should NTPM drop below this level it is probably best to exit partially at least.
Disclaimer:
Trading and investment involves risk, including possible loss of principal and other losses. I shall not be responsible for any losses or loss profit resulting from trading or investment decision based on my posting and information presented in this blog.


Comments
Post a Comment